Developer tools / Independent product
Find out what drained that charge.
A macOS command-line tool that records battery history and per-app energy, so you can look beyond the current battery percentage.
- Product
- batlog
- Platform
- macOS · CLI / TUI
- Built with
- Go, SQLite, Bubble Tea, launchd, GoReleaser
- Made at
- Sevtee, as an independent product

A background recorder keeps history on your Mac. Explore sessions, health trends, and app energy from the terminal, or export your records. Per-app battery cost is an estimate based on energy shares.
What it does
batlog is a macOS command-line tool that records battery level and per-app energy in the background, for days and weeks, so a vague complaint like “my battery only lasts five hours” can be answered with numbers. It started as a tool for my own MacBook and is aimed at people who are comfortable in a terminal.
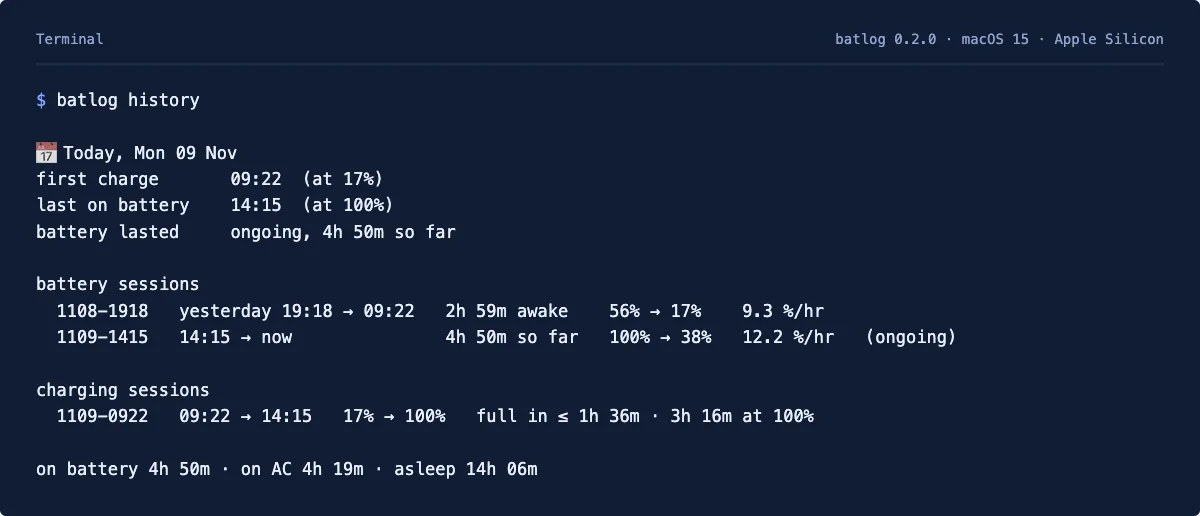
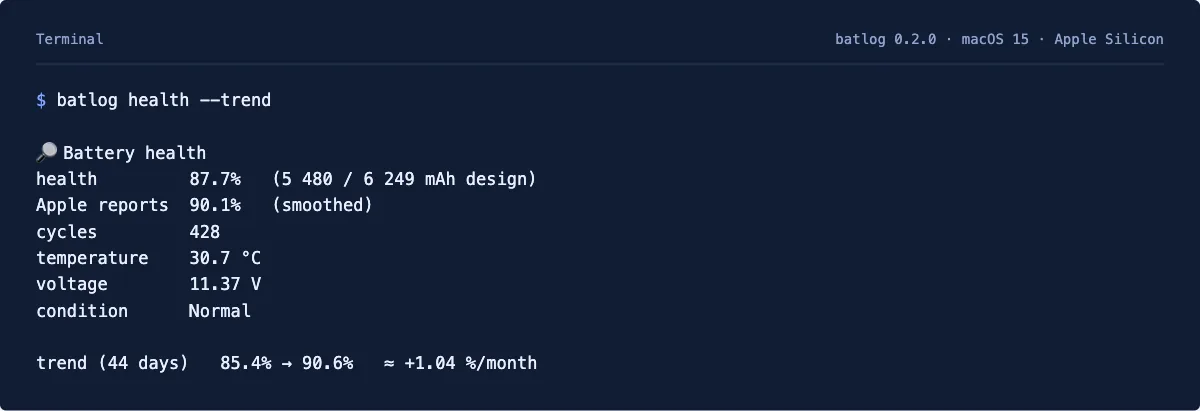
batlog status shows the level, drain rate and a steady time-left estimate. history lists every charge and battery session. top ranks apps by energy share and estimated battery cost. health tracks real capacity against design capacity. report writes a daily or weekly digest, and ui opens a read-only terminal interface with a battery chart. Everything stays on the Mac: no telemetry, no network calls, no sudo.
What was built
- A per-user LaunchAgent that samples once a minute. I built it third in the order, because every day it was not running was history I could never get back.
- A battery reader that parses
ioregoutput as a property list. Dumps sent by other people become golden test fixtures. - Per-app energy read from the kernel’s coalition counters through raw syscalls, in pure Go.
- Ninety days of raw samples, then a daily rollup; CSV and JSON export;
--jsonon every command, with stable exit codes. - A four-view terminal UI built with Bubble Tea: battery chart with a cursor, apps, report and health.
- Releases through GoReleaser and a Homebrew tap, with CI on macOS plus a Linux cross-compile check.
Engineering decisions
- Pure Go with
CGO_ENABLED=0and a pure-Go SQLite. One Linux CI job builds both Mac architectures, tests run anywhere, and the slower database is invisible at about 1,500 rows a day. - Health shows the gauge’s raw measured capacity as the headline, with Apple’s smoothed figure beside it labelled “Apple reports”, so nobody thinks batlog disagrees with macOS.
- Data lives in
~/Library/Application Support/batlog, the macOS convention, so Time Machine backs it up. - Per-app battery cost is shown as a share and an estimate, never as watts, because the counters give joules per app group, not a physical measurement per app.
What I learned
The plan named its riskiest assumption before any Go was written: that top -o power could rank apps fairly. A three-night spike against Activity Monitor said no. top only sees live processes, and one app had spawned 1.5 million short-lived children that held most of its energy, so the ranking was wrong, and the sampling loop itself used 3 to 5 percent of the energy it measured.
The replacement reads the kernel’s per-coalition energy counters directly. On my machine the top eight apps then matched Activity Monitor in order, at a measured cost of 0.004 percent. The first decision stayed in the record as a superseded ADR, three days after it was written, instead of disappearing.
That was also my first time reading a macOS source by syscall instead of shelling out, and I learned to guard non-public kernel layouts with a sanity check that refuses implausible readings and a fixture test on the struct offsets. Smaller lessons: treat gaps over 90 seconds as sleep and exclude them from rates, and walk dates with a local-day helper after a daylight-saving midnight sent the rollup loop spinning.
Working application
The product, in practice.